Q-Step Placement Showcase 2026
Location
G.03 – Doorway 6, Medical School, Teviot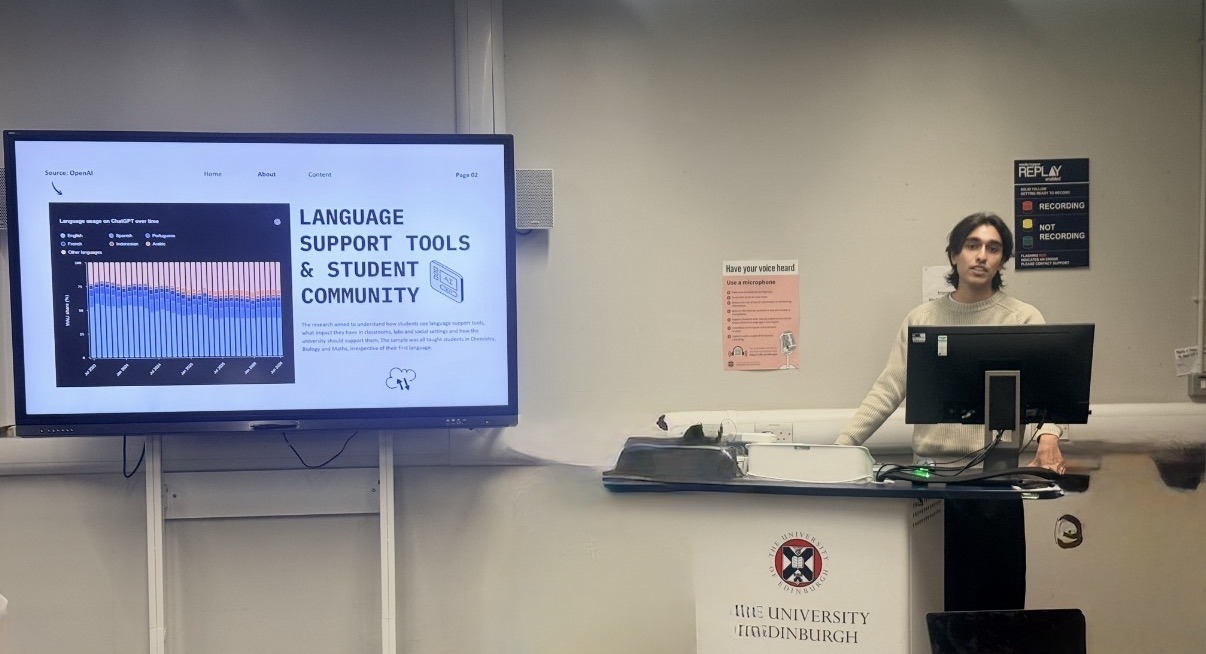
How do you measure how connected people feel to their neighbourhood? What does it take to find out how after-school clubs across a city operate? On 12 November, fourth-year Q-Step students shared the decisions behind their placement projects. Macy Johns, Eric Marshall, Abhinav Cheruttamadathil Gangadharan, Greta Lyon and Cameron Barker-Smith spoke at the showcase.
From the students’ presentations
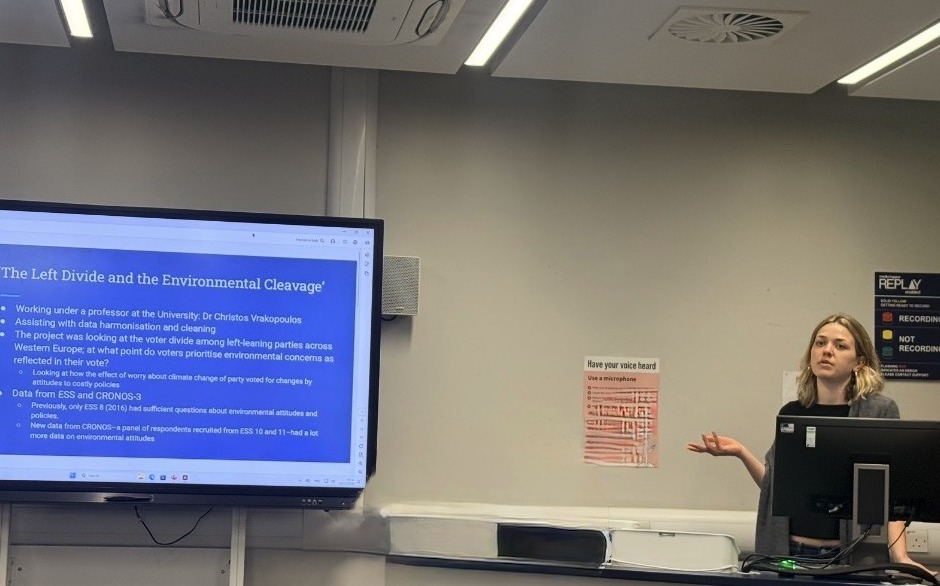
Macy Johns worked with Dr Christos Vrakopoulos on a question about Western European voters: when does concern about climate change translate into a vote for a Green party? She used R to bring European Social Survey and CRONOS-3 panel data into a single dataset, then examined how support for different parties varied with voters’ willingness to pay for environmental policies.
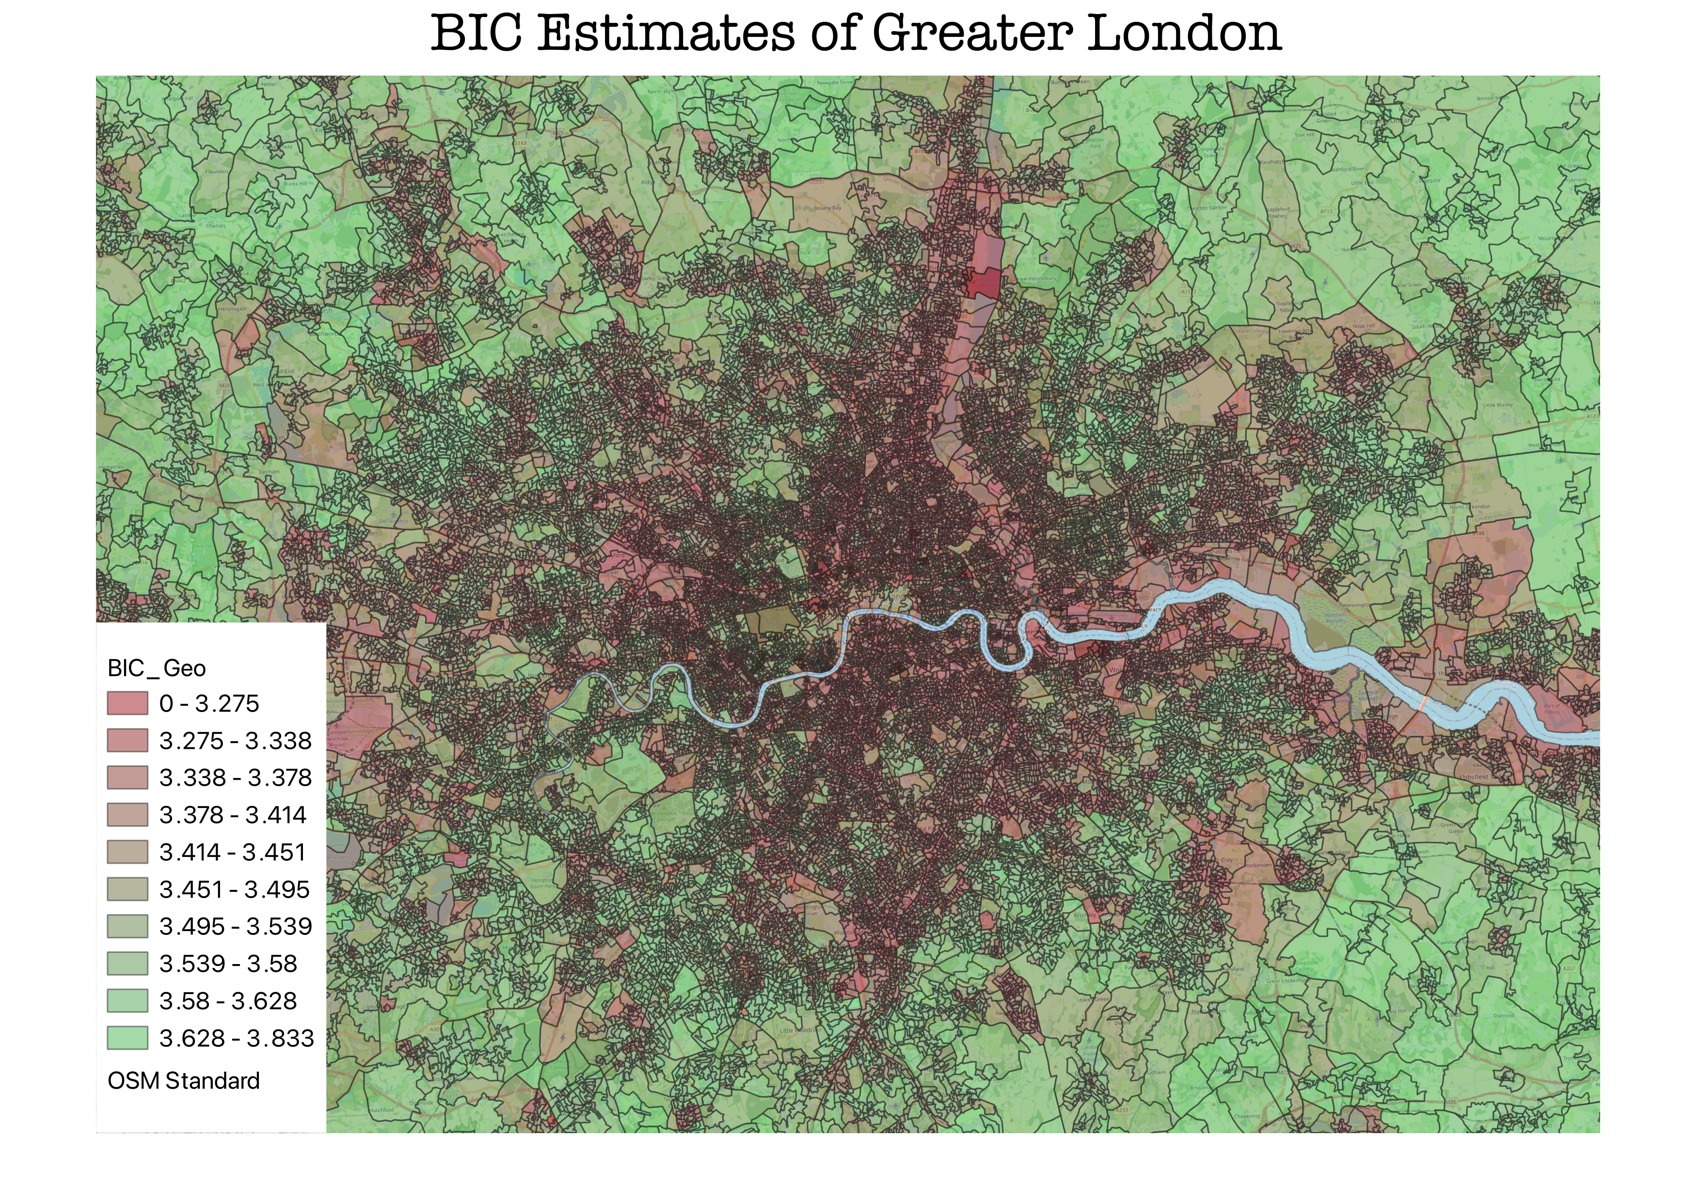
Eric Marshall used Understanding Society survey responses to model how connected people felt to their neighbourhoods. He applied the model to 2021 Census data and mapped the resulting estimates for small areas across England. His map of Greater London shows the detail this approach can offer. As Eric explained, the challenge is checking those estimates in places where nobody was asked the question directly.
Abhinav Cheruttamadathil Gangadharan explored how chemistry, biology and maths students use translation and AI tools in lectures, labs and social settings. Working with Dr David August in the School of Chemistry, he analysed nearly 100 survey responses in R and led a focus group. One surprise was how much of the project went into cleaning the responses before he could analyse them.
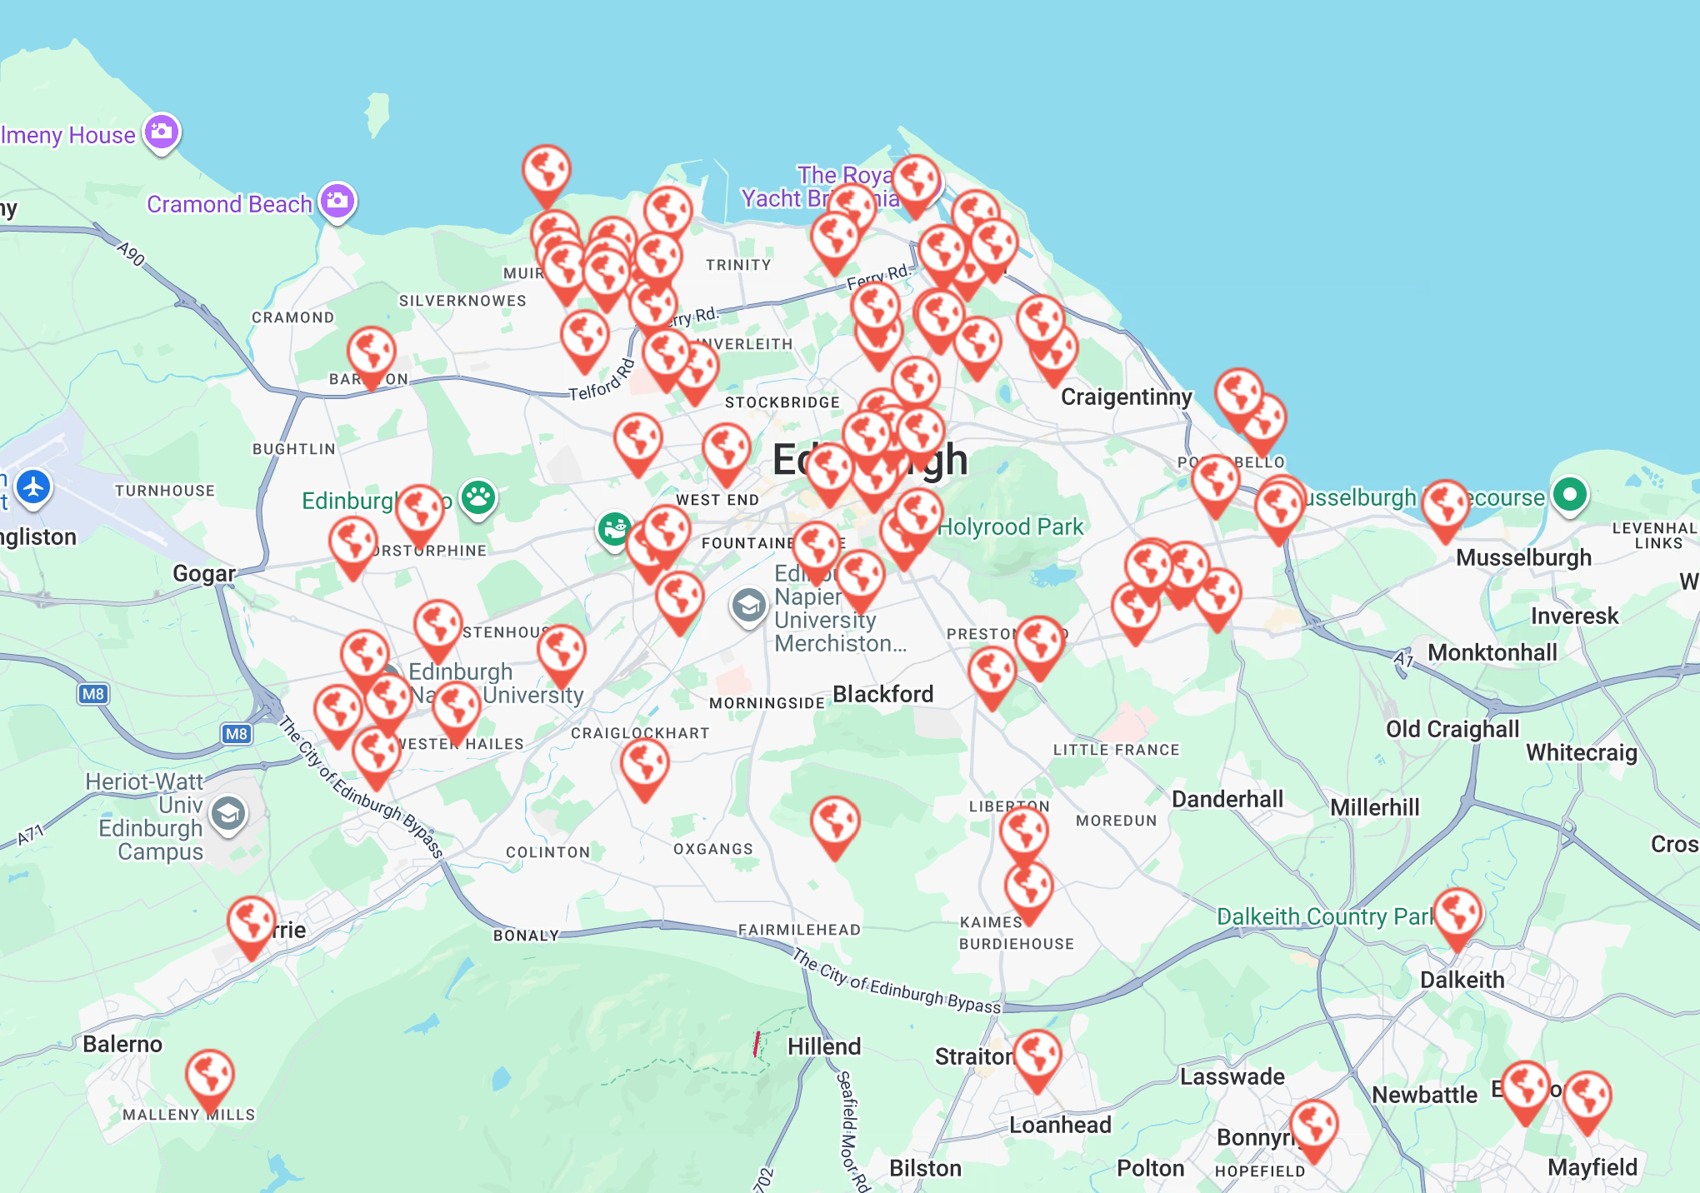
Greta Lyon worked with the Lothian Association of Youth Clubs to review after-school provision across its network. Her brief covered fees, staffing, opening hours and who attended. Greta shared a map of club locations and some practical advice for future placement students: allow more time than you think you’ll need for data collection.
Read the map
Where in Greater London do people feel most connected to their neighbourhood? Pick two neighbouring areas with different colours. Which has the higher estimated score? Use the legend to check your answer.
How Eric made it
Eric started with people who had answered questions about their neighbourhood in the Understanding Society survey. He looked for characteristics linked to their answers, then used census figures to estimate a score for each small area. Two streets can appear in different colour bands even when their scores are close. What local evidence would you want before drawing a conclusion about either street?
Advice for your own placement
- Ask for help when you reach an unfamiliar step. Macy recommended making use of the mentorship on offer, especially when trying something new in R.
- Leave time for the survey after it closes. For Abhinav, cleaning nearly 100 responses took much longer than he expected. Build that time into your analysis plan.
- Keep your collection plan flexible. Greta’s advice from working with after-school clubs was to allow extra time and adapt as the project develops.
Thank you to all five presenters and to the placement hosts and mentors who supported their work.